Madison, WI 53705, U.S.A.
Phone: (608) 238-2171, Fax: (608) 238-9241
Email: info@powline.com
| Home | Search | News | Products |
|
|
610 N. Whitney Way, Suite 160
Madison, WI 53705, U.S.A. Phone: (608) 238-2171, Fax: (608) 238-9241 Email: info@powline.com |
|||
|
Digital data derived from USGS information can be found in many formats and in many places on the Internet both commercially and free, depending on the quality and desired format of the information. This data can be used to develop preliminary transmission line routes, complete with plan & profile drawings and even line costs if the USGS data is accurate enough. While the information is definitely not good enough to produce Released for Construction drawings, it is excellent for preliminary costing of lines and even allows you to begin the procurement process earlier, which is a welcome opportunity in today’s fast-paced Just-In-Time engineering and construction environment.
Two formats commonly used are DRG and DEM.
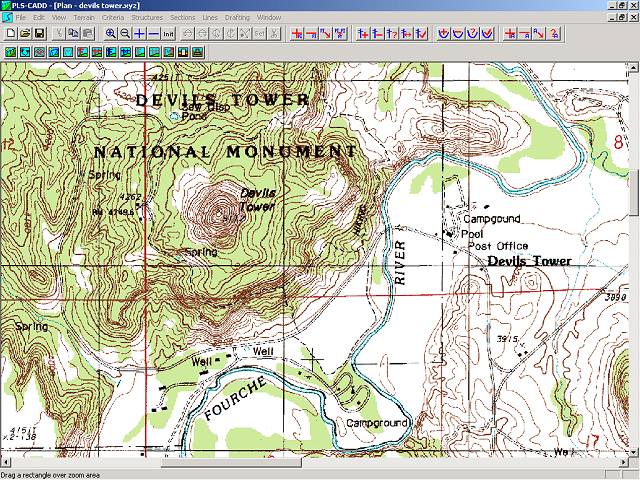
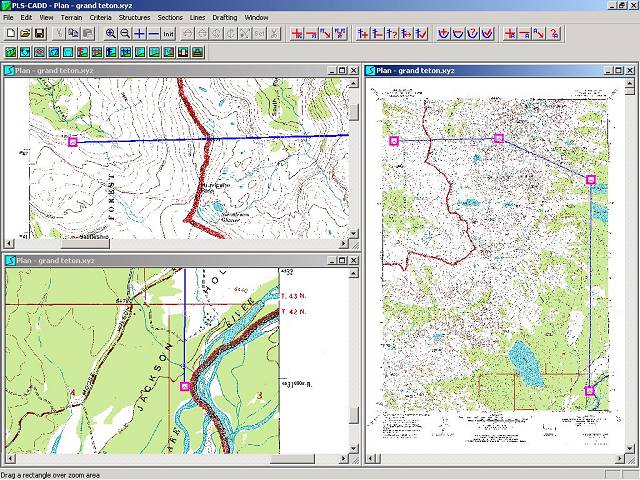
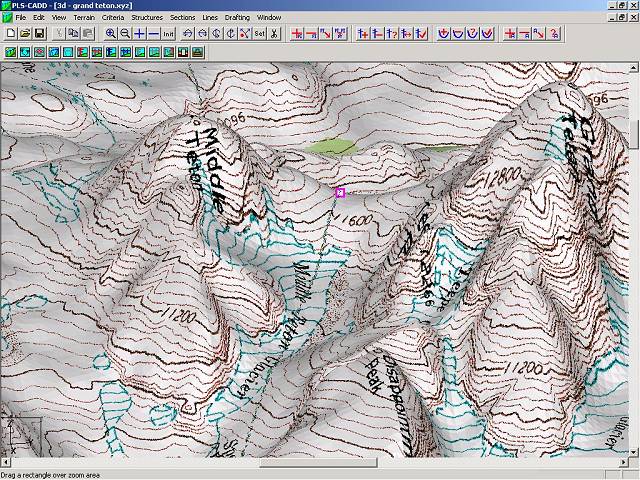
DRG stands for Digital Raster Graphic and is simply a high quality scanned image of a USGS quadrangle "quad" map. A portion of a typical DRG is shown in the PLS-CADD screen shot above. DRGs can come in many different formats:
Using DRGs, preliminary routes can easily be selected while considering man-made objects, terrain and even wetland avoidance. Using this method, many routes can be evaluated very quickly.
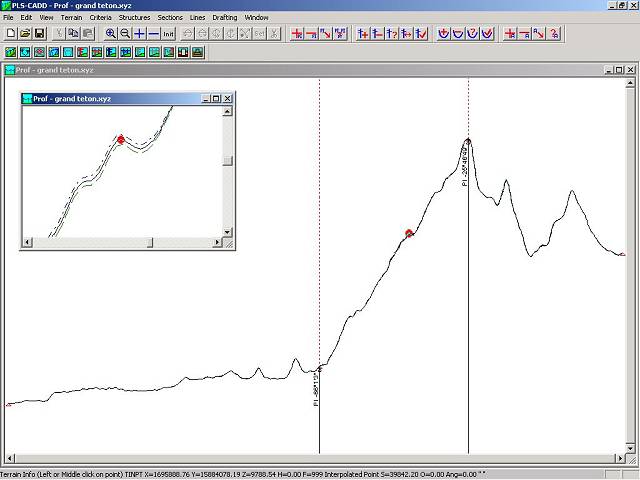
DEM stands for Digital Elevation Model and is merely a set of points, in XYZ format, that are used to develop the contours that you see on USGS quad maps. These points can be imported into PLS-CADD and a TIN (Triangular Irregular Network) can be created from them. This TIN gives us the surface map from which we can then begin cutting profiles over our line routes, including side profiles as illustrated below.
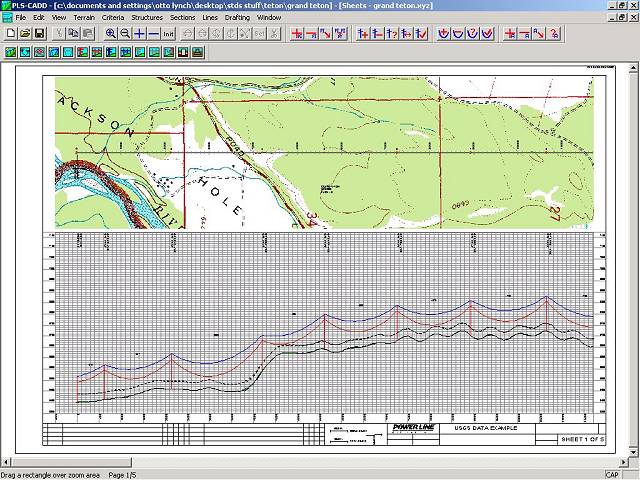
Finally, once the line is designed, Plan & Profile drawings can be made for use with permit applications, public information and even for bidding by line contractors.
As you can see, this is a powerful, quick and accurate way to develop preliminary line designs. And the best part about it is that most of the data is free and can be downloaded from the Internet. You just have to know where to find it and how to use it. The rest of this TechNote will explain this process.
You will need to download the desired USGS data before using it in PLS-CADD. Visit ChartTiff, order and then download the DRG and NED or DEM data for your desired project area. ChartTiff has a very handy search page that will let you find your required quad sheets by several methods, including zip code and prominent feature searches. We recommend obtaining the 10 meter NED data (ChartTiff refers to these as "NEDs") and the collarless DRGs (ChartTiff refers to these as "GEOS"). Once you have placed all of the NEDS and GEOS you need in your shopping cart, you can check out. When you are checking out you can take advantage of one of the best ChartTiff features which is that you can choose your desired coordinate system. If you don't know which system to use, consult with your local surveyor. We highly recommend obtaining your data in the same coordinate system that your final survey data will be delivered to you in. For more information on working with data in different projections and coordinate systems see our Using Coordinate Systems and Projections with PLS-CADD Technical Note. Finally, the most important option you need to select is in the "Output File Format for NEDs and DEMs" section, make sure and select the "PLS-CADD XYZ File Format" option - this will deliver the data to you ready to be imported directly into PLS-CADD. You might also want to check the "zip" option for quicker downloading of the data, but make sure you have a program that will unzip files first. At the time of the development of this TechNote, you can download individual quads for $4 for the NED and $2 for the GEO (collarless DRG). You can obtain even better pricing for bulk purchases and with advance payments - make sure and select the best option for your project or even your entire grid. You can purchase whole states delivered on CD for a few hundred dollars.
Note that as an alternative to purchasing the DRGs from ChartTiff you can download them as well as DOQQs (aerial photography) directly from PLS-CADD using the Drafting/Attachments/TerraServer Image Download command. You can watch this video to see how this works.
Now that you have all the data, and conversion files downloaded, the process to get them into PLS-CADD is simple.
Let’s now overlay the DRGs and get a picture so that these points make some sense. You can do this in one of two ways:
If you selected the same quad for both the NED or DEM and the DRG, they should perfectly overlap each other. You can now begin spotting proposed transmission routes, and getting preliminary Plan & Profile drawings and line costs without ever even having to send a survey crew into the field. This method can be duplicated for each quad involved with your project, except use the Terrain/Edit/Merge XYZ Points from User Defined XYZ File for importing successive DEM text files. Again, properly done, they fall next to each other and you can build the maps for the entire route of your transmission line.
This method works great for loading a quad or two on "middleweight" computers. However, on longer lines, or on inadequate machines, the data can overload the computers capabilities (PLS-CADD has no limitations). For this reason, we recommend defining your centerline first and then using the filter option to only pull in points a specified distance left and right of the centerline to keep the data set smaller and thus more manageable. For a video showing how to do this, please see Using USGS Data in PLS-CADD Video.
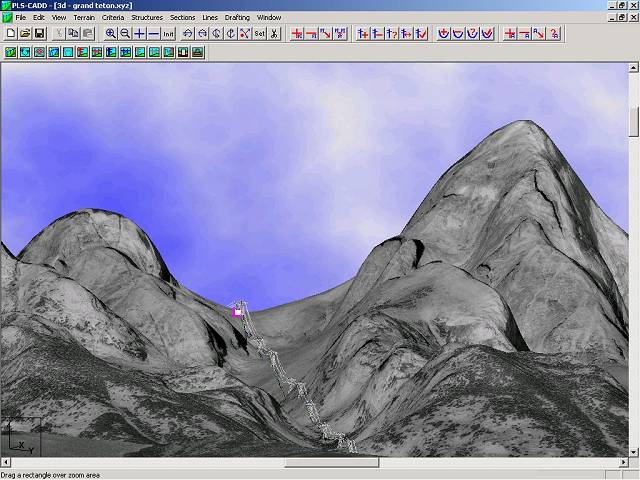
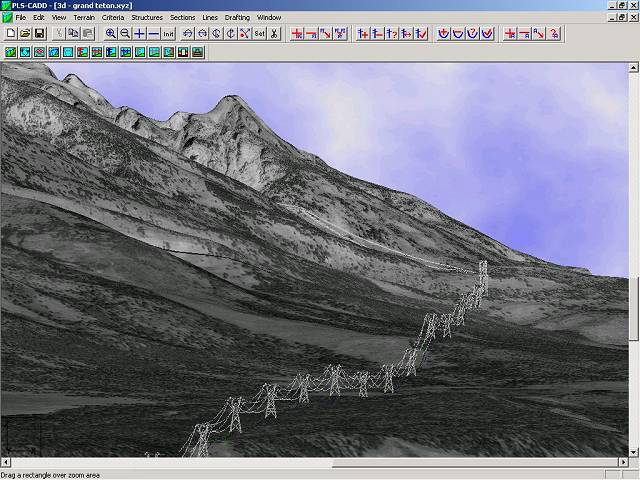
Following is a PLS-CADD screen shot of a TIN created in PLS-CADD with a hypothetical transmission line design that crosses between the Grand Teton and Middle Teton mountains in Wyoming.
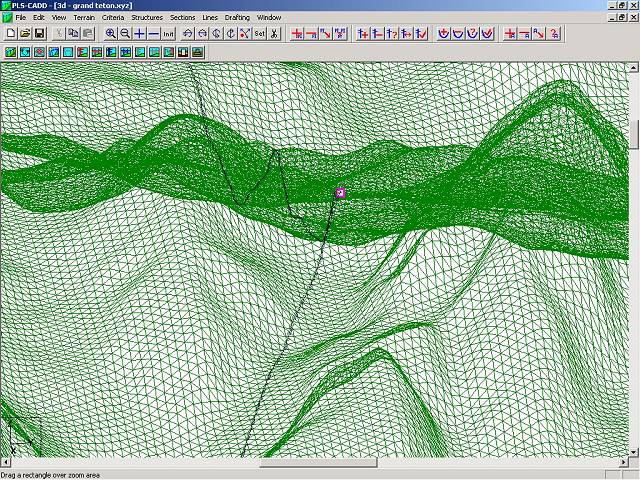
Once you have the TIN created, you can use the TIN rendering options to show the USGS quads draped over the TIN for awesome 3-d renderings, complete with structures if you like.
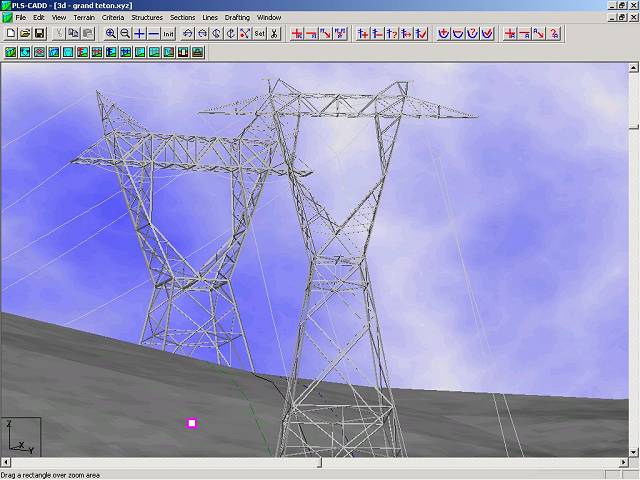
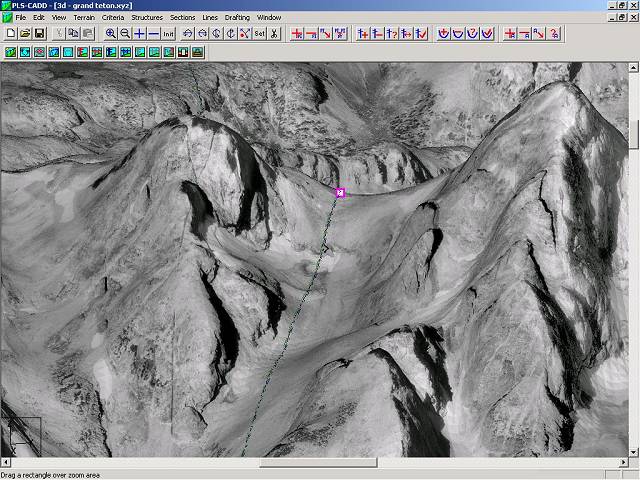
Additionally, even though there are not many sites where they can be downloaded for free, DOQs (Digital Ortho Quads) can be used in the exact same way as the DRGs. DOQ’s can be purchased directly from USGS at USGS DOQs or downloaded from within PLS-CADD using the Drafting/Attachments/TerraServer Image Download command. You can get them in black and white, and sometimes even in color. The DOQs can then be draped over the TIN to create nearly photo realistic views of your transmission line.
When our structure programs, PLS-POLE or TOWER, are used to model the structures they can be drawn with a true graphical representation as well.